What are non-linear graphs?
A non-linear graph is any graph that is not a straight line. The relationship between x and y involves a power, a fraction, or an exponential. At GCSE you need to recognise, sketch and interpret four types:
- Quadratic — y = ax² + bx + c (a U-shaped or ∩-shaped parabola)
- Cubic — y = ax³ + bx² + cx + d (an S-shaped curve)
- Reciprocal — y = a/x (two separate curves, never touching the axes)
- Exponential — y = aˣ or y = a × bˣ (a curve that grows or decays rapidly)
For each type you need to be able to plot the graph from a table of values, sketch its general shape, and use it to solve equations or read off approximate solutions.
Quadratic graphs
The graph of y = ax² + bx + c is a parabola. When a > 0 it is U-shaped (minimum point); when a < 0 it is ∩-shaped (maximum point). The parabola is always symmetrical about its turning point. To plot it, substitute x values into the equation to build a table, then join the points with a smooth curve — never straight lines between points.
Worked Example 1 — Plotting a quadratic graph
Complete the table of values for y = x² − 2x − 3 for −2 ≤ x ≤ 4 and identify the turning point
1
Substitute each x value: x = −2: (−2)² − 2(−2) − 3 = 4 + 4 − 3 = 5
2
x = −1: 1 + 2 − 3 = 0 | x = 0: 0 − 0 − 3 = −3 | x = 1: 1 − 2 − 3 = −4
3
x = 2: 4 − 4 − 3 = −3 | x = 3: 9 − 6 − 3 = 0 | x = 4: 16 − 8 − 3 = 5
4
The lowest y value is −4 at x = 1, so the turning point (minimum) is (1, −4)
AnswerValues: 5, 0, −3, −4, −3, 0, 5 | Turning point: (1, −4)
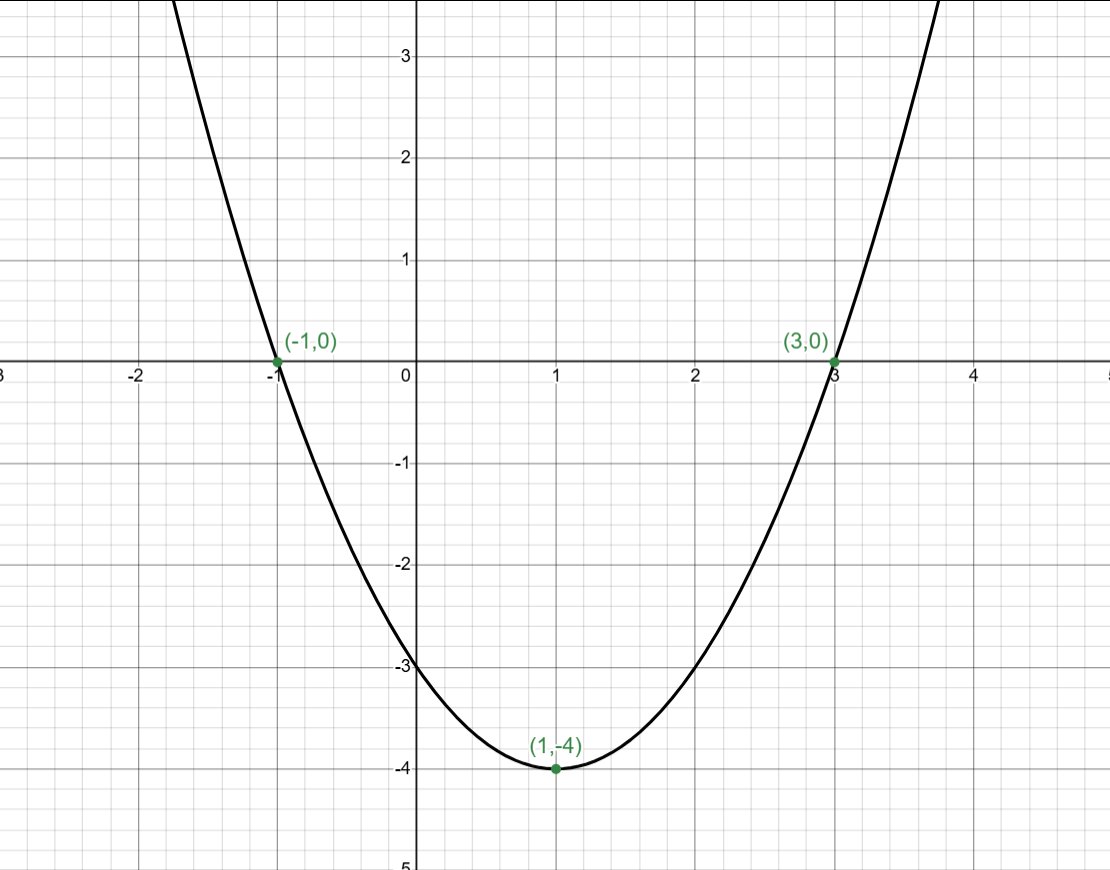
Graph of y = x² − 2x − 3: roots at (−1, 0) and (3, 0), minimum point at (1, −4)
Cubic graphs
A cubic graph has an x³ term as the highest power. When the coefficient of x³ is positive, the curve goes from bottom-left to top-right. When it is negative, the curve goes from top-left to bottom-right. Cubic graphs can have one or two turning points (a local maximum and minimum).
Worked Example 2 — Sketching a cubic graph
Sketch the graph of y = x³ − 3x, marking where it crosses the axes
1
Find the y-intercept (x = 0): y = 0 − 0 = 0, so it passes through (0, 0)
2
Find the x-intercepts — set y = 0: x³ − 3x = 0 → x(x² − 3) = 0 → x = 0, x = √3, x = −√3
3
Crosses at approximately (−1.73, 0), (0, 0) and (1.73, 0)
4
Positive leading coefficient → curve rises left to right with an S-shape
Answerx-intercepts at x = 0, x = ±√3 ≈ ±1.73; S-shaped curve rising left to right
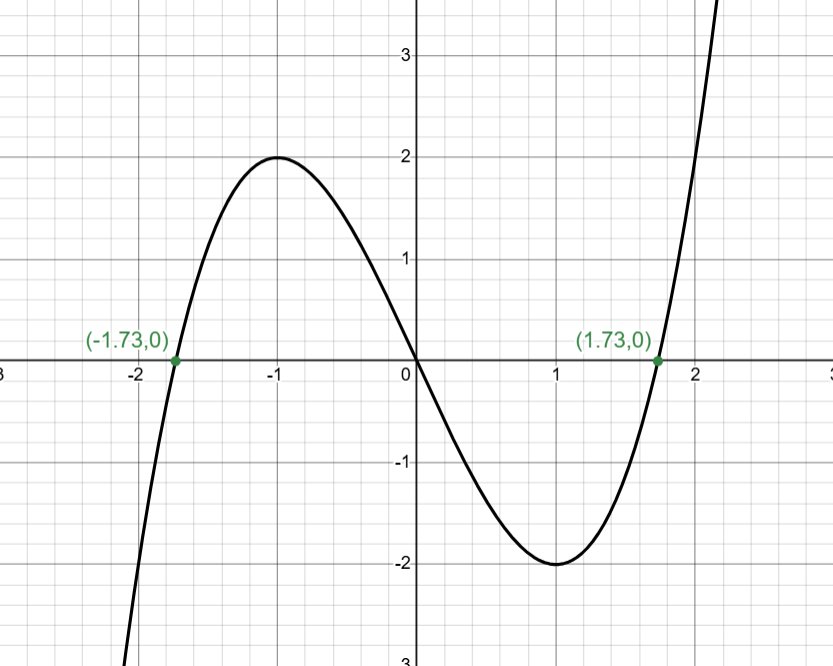
Graph of y = x³ − 3x: roots at (−√3, 0), (0, 0) and (√3, 0) ≈ (±1.73, 0); S-shaped curve rising left to right
Reciprocal graphs
The reciprocal graph y = a/x has two separate branches and never touches the x-axis or y-axis (the axes are called asymptotes). When a > 0, both branches are in the top-right and bottom-left quadrants. When a < 0, they move to the top-left and bottom-right quadrants.
Worked Example 3 — Table of values for a reciprocal graph
Complete the table of values for y = 6/x for x = −6, −3, −2, −1, 1, 2, 3, 6
1
Substitute each x: x = −6 → y = 6/(−6) = −1 | x = −3 → y = −2 | x = −2 → y = −3
2
x = −1 → y = −6 | x = 1 → y = 6 | x = 2 → y = 3 | x = 3 → y = 2 | x = 6 → y = 1
3
Note: x = 0 is undefined — never substitute x = 0 into a reciprocal
Answery values: −1, −2, −3, −6, 6, 3, 2, 1 | Two separate smooth curves, axes are asymptotes
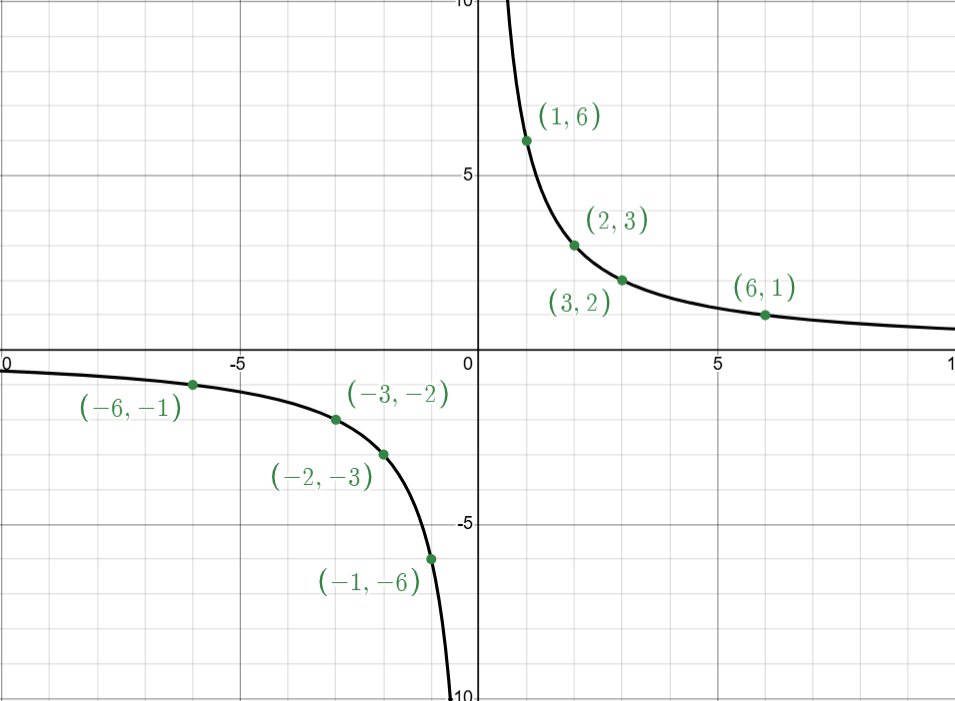
Graph of y = 6/x: two separate branches in quadrants 1 and 3; both axes are asymptotes
Exponential graphs
An exponential graph y = abˣ (where b > 0 and b ≠ 1) rises or falls extremely steeply. Key features: the graph always passes through (0, a), is always above the x-axis, and the x-axis is an asymptote. When b > 1 the graph grows; when 0 < b < 1 the graph decays.
Worked Example 4 — Exponential graph features
For y = 2ˣ, state the y-intercept, describe the shape, and find the value when x = 4
1
y-intercept (x = 0): y = 2⁰ = 1, so the graph passes through (0, 1)
2
Since the base 2 > 1, this is a growth curve — it rises steeply to the right and approaches y = 0 (but never reaches it) to the left
Answery-intercept = 1; growth curve; y = 16 when x = 4
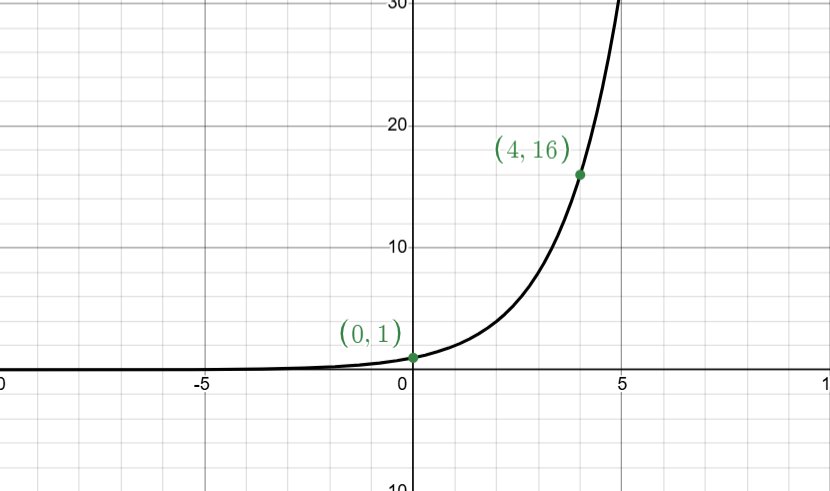
Graph of y = 2ˣ: passes through (0, 1) and (4, 16); growth curve with x-axis as asymptote
Practice questions
Work through each question before checking the answers. Difficulty is shown for each question.
Foundation (Grade 3–5)
Q1Complete the table for y = x² + 1 using x = −2, −1, 0, 1, 2Foundation
Q2Describe the shape of the graph y = −x². Does it have a maximum or minimum point?Foundation
Q3For y = 4/x, find y when: (a) x = 2 (b) x = −4 (c) x = ½Foundation
Q4For y = 3ˣ, find y when x = 0, x = 2 and x = 3Foundation
Q5State the name of the graph type for each: (a) y = 5x² (b) y = 2/x (c) y = x³ (d) y = 4ˣFoundation
Higher (Grade 5–7)
Q6Complete the table for y = x² − 4x + 3 for x = 0 to x = 4, then state the turning pointHigher
Q7Use your graph from Q6 to find the values of x where y = x² − 4x + 3 = 0Higher
Q8Sketch y = x³ − x, marking where the curve crosses the x-axisHigher
Q9For y = 2ˣ, complete a table for x = −2, −1, 0, 1, 2, 3 (give values as fractions where needed)Higher
Q10Describe the key features of the graph y = −3/x, including the quadrants its branches lie inHigher
Higher — Hard (Grade 8–9)
Q11By drawing y = x² − 2x − 3 and y = x + 1 on the same axes, find the x-coordinates of their intersection pointsGrade 8–9
Q12Sketch y = x³ − 4x² + 4x and find where it meets the x-axis. Describe the nature of any repeated roots.Grade 8–9
Q13The graph y = abˣ passes through (0, 5) and (2, 45). Find the values of a and b.Grade 8–9
Q14On the same axes, sketch y = 2ˣ and y = 2⁻ˣ. Describe the relationship between the two graphs.Grade 8–9
Q15Explain why the graph y = 1/x² differs from y = 1/x in terms of symmetry and the quadrants its curve occupies.Grade 8–9
Answers
Foundation (Q1–Q5)
Q1y = 5, 2, 1, 2, 5(x = −2: 4+1=5; x = −1: 1+1=2; x = 0: 1; x = 1: 2; x = 2: 5)
Q2∩-shaped parabola; maximum point at (0, 0)(negative coefficient of x² means it opens downward)
Q3(a) y = 2 (b) y = −1 (c) y = 8(4/2=2; 4/−4=−1; 4÷½=8)
Q4x=0: y=1; x=2: y=9; x=3: y=27(3⁰=1; 3²=9; 3³=27)
Q5(a) Quadratic (b) Reciprocal (c) Cubic (d) Exponential
Higher (Q6–Q10)
Q6y = 3, 0, −1, 0, 3; turning point (minimum) at (2, −1)(x=0:3; x=1:0; x=2:−1; x=3:0; x=4:3)
Q7x = 1 and x = 3(where the curve crosses the x-axis, i.e. y = 0)
Q8Crosses x-axis at x = −1, x = 0, x = 1(x³ − x = x(x²−1) = x(x+1)(x−1) = 0)
Q9y = ¼, ½, 1, 2, 4, 8(2⁻²=¼; 2⁻¹=½; 2⁰=1; 2¹=2; 2²=4; 2³=8)
Q10Two branches; top-left and bottom-right quadrants (2nd and 4th); asymptotes on both axes; never crosses axes(negative a in y=a/x flips the branches)
Higher — Hard (Q11–Q15)
Q11x = −1 and x = 4(set equal: x²−2x−3 = x+1 → x²−3x−4=0 → (x+1)(x−4)=0)
Q12Meets x-axis at x = 0 and x = 2 (repeated root); x=2 is a turning point touching the axis(x³−4x²+4x = x(x−2)² = 0 → x=0 or x=2 twice)
Q13a = 5, b = 3(x=0: 5=a×b⁰=a; x=2: 45=5b² → b²=9 → b=3)
Q14Both pass through (0,1); y=2ˣ rises right, y=2⁻ˣ rises left; they are reflections of each other in the y-axis
Q15y=1/x² is always positive so only occupies quadrants 1 and 2; it is symmetric about the y-axis. y=1/x occupies quadrants 1 and 3 with no symmetry about either axis.
Common mistakes
These are the errors Alamin sees most frequently with non-linear graphs at GCSE. Recognising them now will save you marks in the exam.
Common Mistake 1
Joining plotted points with straight lines
Non-linear graphs must be drawn as smooth curves, not a series of straight lines connecting the points. Straight segments between points will cost marks, even if all the plotted points are correct.
Common Mistake 2
Sign errors when squaring negative x values
When x = −3, x² = (−3)² = 9, not −9. Always use brackets around negative values before squaring. This is the most common source of wrong values in a quadratic table.
Common Mistake 3
Substituting x = 0 into a reciprocal graph
y = a/x is undefined at x = 0 — you cannot divide by zero. Never include x = 0 in a table of values for a reciprocal graph, and always leave a gap in the middle when drawing the two branches.
Common Mistake 4
Thinking the reciprocal graph touches the axes
The curves of y = a/x approach the x and y axes but never touch them. The axes are asymptotes. Drawing the curve touching or crossing an axis will lose marks.
Common Mistake 5
Confusing growth and decay in exponential graphs
For y = abˣ: if b > 1 it is growth (rises to the right); if 0 < b < 1 it is decay (falls to the right). A common error is sketching the wrong direction. Also remember: the graph always stays above the x-axis when a > 0.
Common Mistake 6
Misidentifying the turning point of a quadratic
The turning point is the vertex of the parabola — the lowest point for U-shapes and the highest for ∩-shapes. Students often read the turning point incorrectly from a table by picking the smallest y value without checking the x coordinate carefully. The turning point is a coordinate pair, e.g. (2, −1), not just a y-value.
Want to improve your grade faster?
If non-linear graphs are still causing problems, Alamin's diagnostic approach identifies exactly which skills are missing and builds a targeted plan to address them — with AI-powered practice between sessions to reinforce what's been taught.
Book an Assessment Session (£60)
No upfront payment required — payment is taken after confirmation.